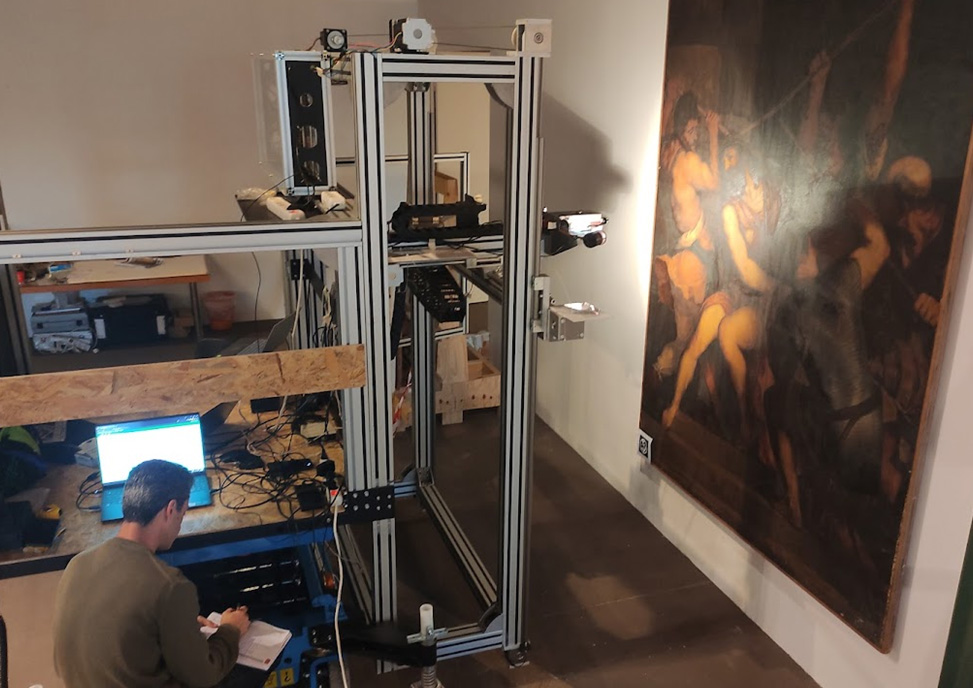
The painting “The Flagellation of Christ” was studied using the technique “Diffuse Reflectance Imaging Spectroscopy”, through the HSI camera. For this purpose and in order to scan the entire surface of the painting, the robotic system developed in the framework of the PROTEAS project was used, as well as the special software developed for the control of all analytical and imaging systems.
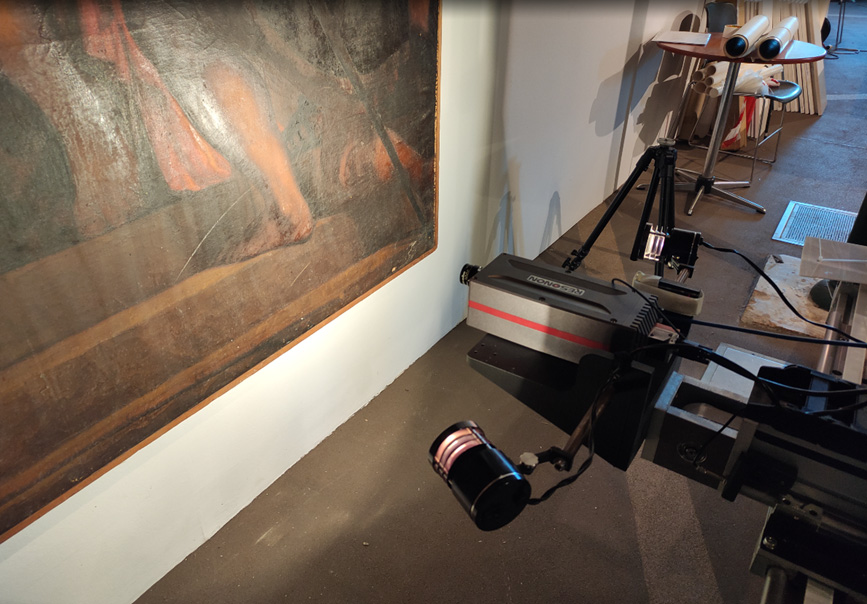
In order to record the data for the whole area of the painting, its surface was divided into 6 x 13 individual sections. The horizontal sections were designated numerically from “1” to “6” while the vertical sections were designated by letters from “A” to “N”. Sections were scanned sequentially and with an overlapping study areas between them. The data were saved and followed by post-processing, which was very time-consuming due to the large volume of data. (Snapshots from the application of Diffuse Reflectance Spectroscopy in the project “The Flagellation of Christ” in the area of the Glyptotheque, images 1-2.)

The post-processing of the imaging data recorded was mainly aimed at mapping the pigments of the painting. The study was carried out in combination with the study of the work using Imaging X-ray Fluorescence Spectroscopy (MSI-XRF) which has the capability of elemental characterization of the materials and thus accurate identification of pigments, but requires extremely long times to scan large surfaces with high spatial resolution. Compared to XRF, the MSI technique is disadvantaged in analytical capability but has advantages in the speed of scanning large surfaces. Combined, the two techniques can exploit their individual advantages and allow a complete and detailed analysis of a painting.
In order to record data for the entire painting, the surface of the painting was divided into 6 x 13 individual sections. The horizontal sections were designated numerically from “1” to “6” while the vertical sections were designated by letters from “A” to “N”. The scanning of the segments was sequential and with an overlapping of study areas between them (Figures 1, 2). The data were saved and followed by post-processing, which was very time consuming due to the large volume of data.
The post-processing of the imaging data recorded was mainly aimed at mapping the pigments of the painting. The study was carried out in combination with the study of the work using Imaging X-ray Fluorescence Spectroscopy (MSI-XRF) which has the capability of elemental characterization of the materials and thus accurate identification of pigments, but requires extremely long times to scan large surfaces with high spatial resolution. Compared to XRF, the MSI technique is disadvantaged in analytical capability but has advantages in the speed of scanning large surfaces. Combined, the two techniques can exploit their individual advantages and allow a complete and detailed analysis of a painting.
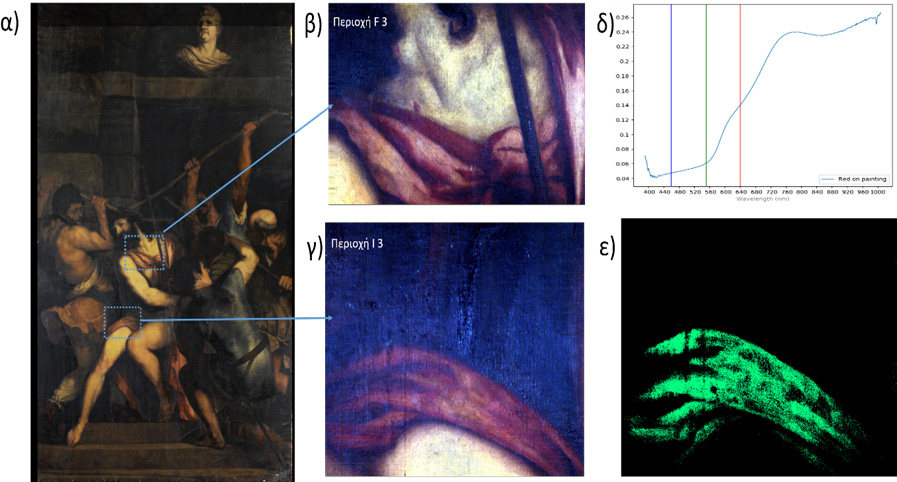
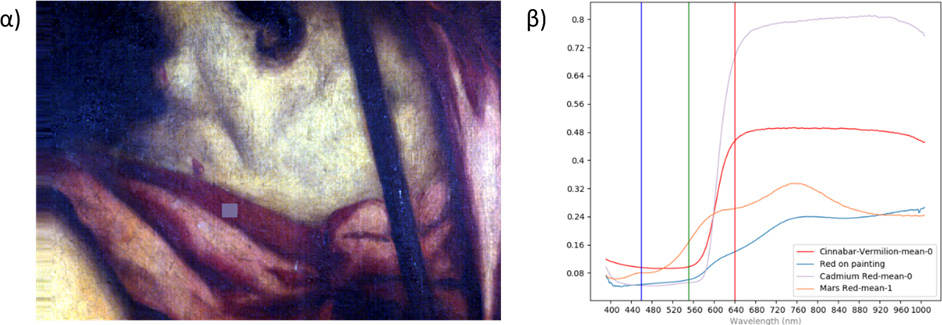
Figure 3 shows the results of the processing of the spectral cube obtained from a typical segment (I4) of the panel. The red dye of this region was studied. First, the diffuse reflectance spectrum was extracted in order to identify the pigment. To identify the dye, the reflectance spectrum is compared with standard spectra of known dyes. It is evident from the diagram that the spectrum obtained from the red pigment in the table (blue curve) follows the pattern (two ‘shoulders’ appear) of the curve (orange curve) of Mars red (Fe2O3). A differentiation between the two curves appears in the near infrared region (800-1000 nm) which is interpreted as a possible impurity with a white pigment.
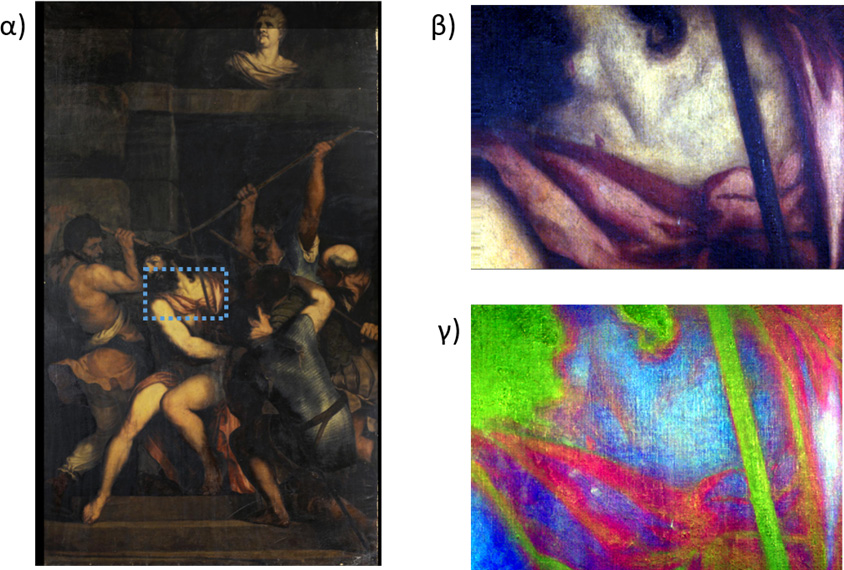
Then, using Principal Component Analysis (PCA), the dispersion of the red pigment as well as other pigments in this section was mapped (Figure 4a,b). The mapping of these pigments is shown in Figure 15c, where false colours have been used to represent each different pigment. In particular, red has been used to map the red pigment, blue for the white pigment and green for the black pigment. Areas are also identified where there is a mixture between two pigments, notably red and white.
Τέλος, αξιοποιήθηκε η μέθοδος Spectral Angle Mapper (SAM) για την ταυτοποίηση της ίδιας χρωστικής που βρίσκεται σε διαφορετικά τμήματα. Στην εικόνα 5 παρουσιάζεται η συγκεκριμένη διαδικασία για τη συσχέτιση της κόκκινης χρωστικής μεταξύ των τμημάτων Ι4 και F3.