In the framework of the project PROTEAS, measurements were initially carried out on the painting “The Flagellation of Christ” by Antonios Vroudzos, a work belonging to the collection of the National Gallery of Greece, dating from 1878 and measuring 300 x 180 cm2.The painting is generally in good condition and maintenance work has recently been carried out to remove the varnish in selected areas. The measurements were carried out in a specially designed area of the Glyptotheque during the period of June 2023 and contributed to (a) checking the proper functioning of the interface software and scanning methodology and (b) evaluating the overall performance of the MA-XRF setup, scanner and platform in terms of analytical data collection and management for the documentation of large-scale paintings.
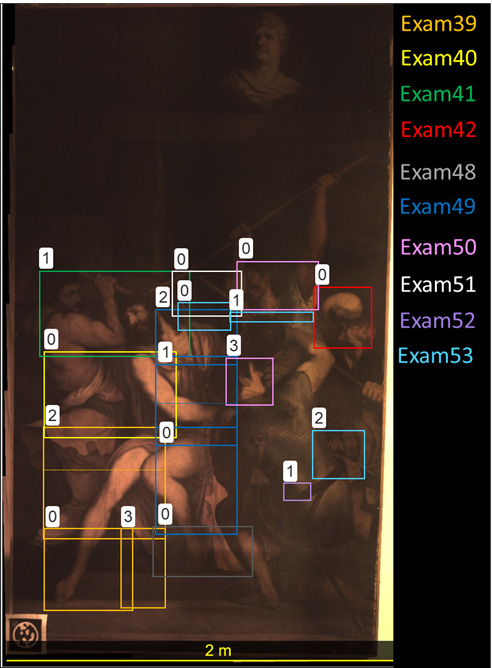
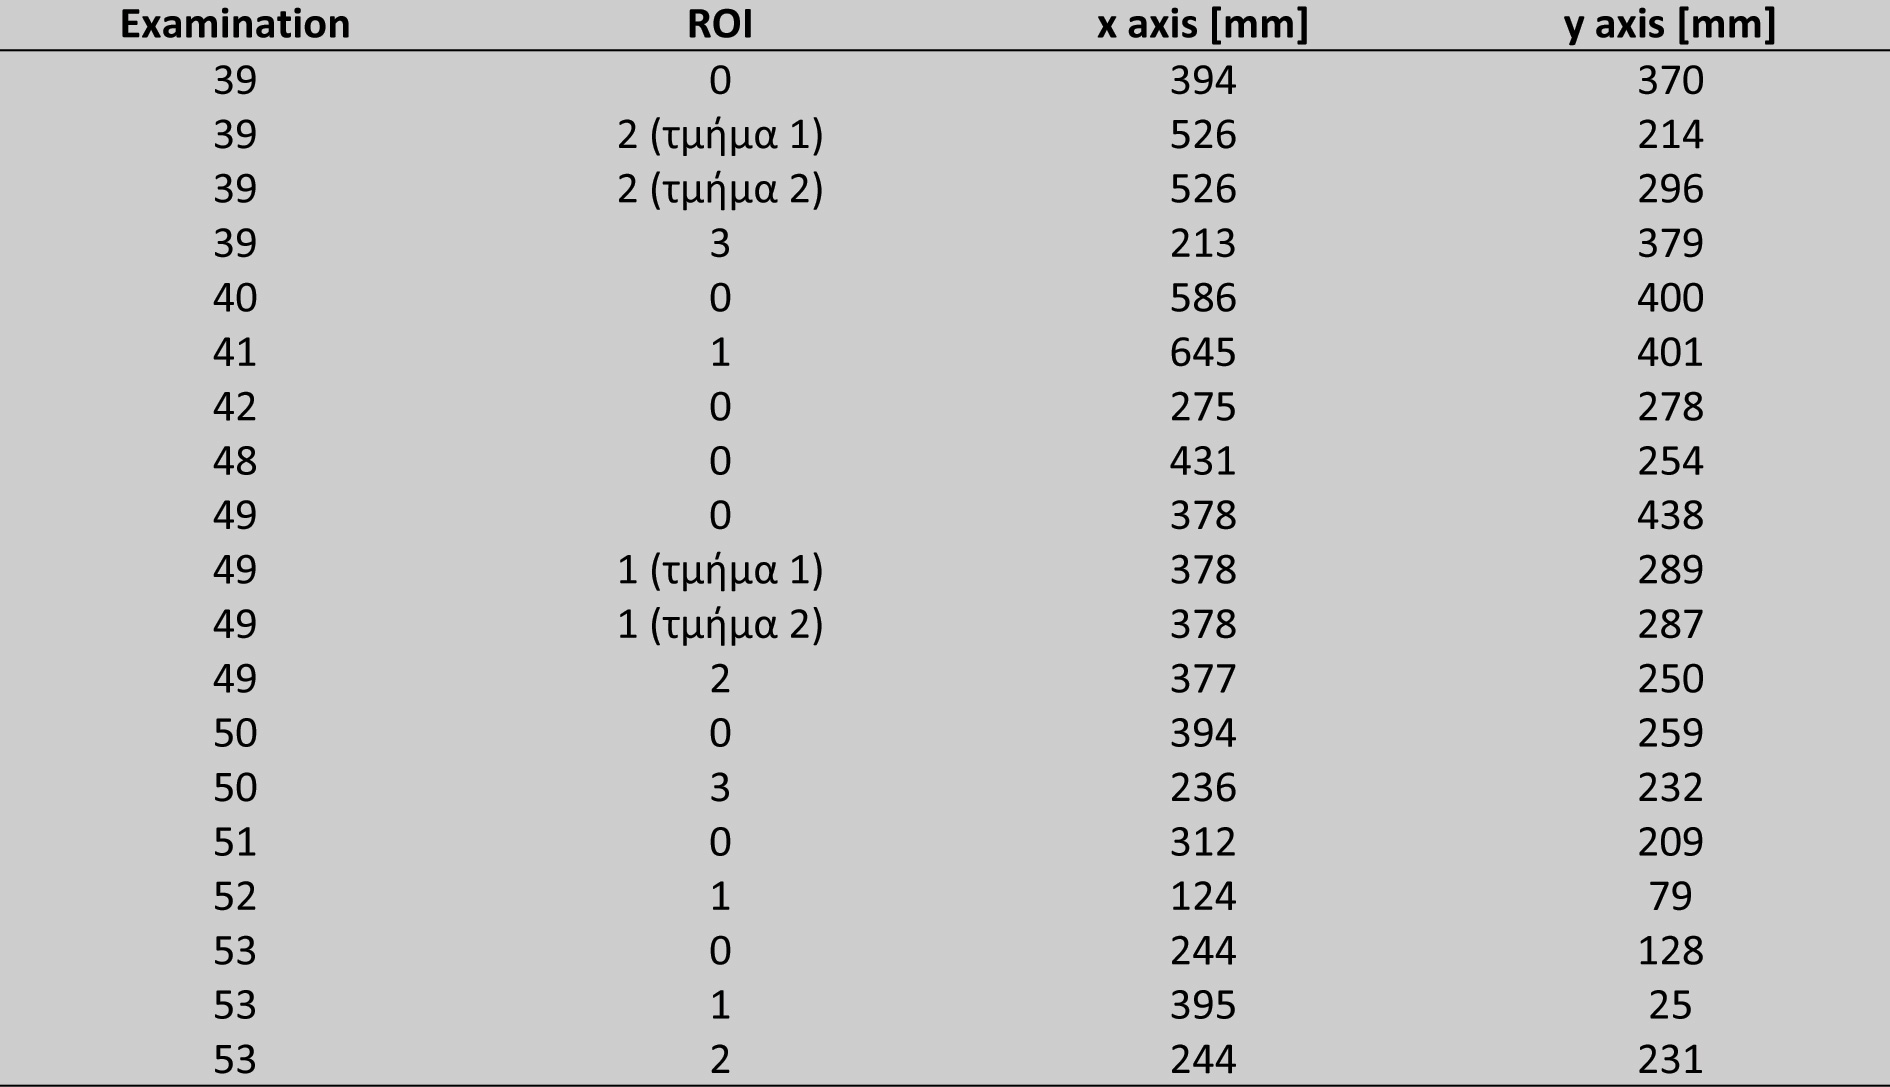
The analyses focused on human representations, with emphasis on the depiction of Christ, as they show variation in the pigments and techniques used. For the analysis of the painting, a total of 19 surface scans were carried out, with the majority of these showing approximately 10% overlap. In general, it was preferred to make scans of relatively small dimensions (maximum dimension on the horizontal and vertical axes, 645 mm and 400 mm respectively) in relation to the range of movement of the platform axes due to the fact that (a) the surface of the painting was not fully parallel to the vertical plane, for example at a length of 40cm there was a variation in the distance of the spectrometer head from the painting surface of 13mm (between the closest and furthest distance) and (b) scans of larger dimensions require a time of > 6h, which was not available during access to the Glyptotheque site.

Figure 1 shows the regions of interest (ROIs) of the examinations (examination), which were created in total, through the synthesis program, for the study of the panel. Also shown in Table 1 are the dimensions of the individual regions of interest in millimeters (mm). The examinations (examination) 39_Roi2 and 49_Roi1, were ultimately carried out in two sections each, to ensure the smallest possible variation in the variation in distance from the painting. Total measurement times ranged from 1h to 6h.
Each scan provides an aggregated spectrum, which, through the PyMCa program [1], is analysed and gives a first estimate of the elemental composition of the painted surface. The elemental maps extracted from this processing depict the surface intensity distribution of each detected element. Further processing of the elemental maps is performed by the ImageJ program [2]. ImageJ is a Java-based image processing program developed at the National Institutes of Health and the Laboratory for Optical and Computational Instrumentation (LOCI, University of Wisconsin). It enables the user to process and analyze many image file formats (TIFF, PNG, GIF, JPEG, BMP, DICOM, FITS, etc.) and can compute statistics for a pixel or even an area of interest. Within the MA-XRF technique, the application of the program is limited to the generation of complex elemental maps (simultaneous visualization of the distribution of up to 8 chemical elements of the analyzed surface) and their stitching (integration of individual imaging maps of a chemical element with overlapping optical fields to produce a larger elemental map).
Results
In this study, various areas were analysed to investigate the materials used in the painting. The pigments identified/suggested are compatible with those available to artists in the second half of the 19th century. The following paragraph gives indicative results of the analysis of inorganic pigments and their application techniques.
The main elements detected are lead (Pb), iron (Fe), calcium (Ca), chromium (Cr), cadmium (Cd), tin (Sn), mercury (Hg). Also detected as trace elements are barium (Ba), copper (Cu), potassium (K), manganese (Mn), sulphur (S), titanium (Ti), vanadium (V) and zinc (Zn).
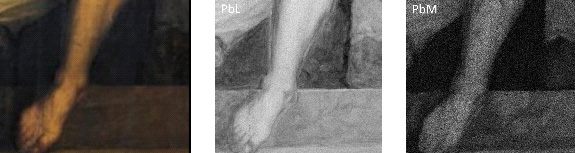
Lead (Pb) is detected on almost the entire painting surface, at least in the areas examined, probably due to the use of the lead white pigment (2PbCO3-Pb(OH)2) in mixture with other pigments to achieve lighter shades. It may also have been used as an imprimitura layer, most probably as lead white. This hypothesis is not supported by comparison of the elemental maps of Pb, as derived from the intensities of two different X-ray characteristics of Pb (L- and M-) (Figure 2). The Pb-M X-ray features, due to significantly lower energy, are detected from much shallower depths than the Pb-L features, allowing us to evaluate the stratification of the Pb distribution (distribution in depth). We note that there is no significant difference between the two Pb maps.
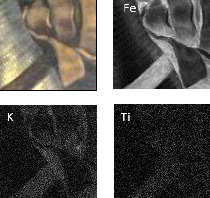
The presence of iron (Fe) is detected in dark areas. For the rendering of hair and dark background, increased use of iron-containing pigment is observed. Also, this pigment is used over other colour layers to create light shading. Comparing the distributions of titanium (Ti) and potassium (K), it is observed that they correlate with the corresponding distribution of iron (Figure 3), leading to the conclusion that they are minor elements or trace elements contained in the iron pigment.
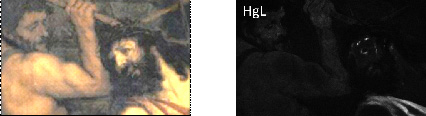
Ο υδράργυρος (Hg) ανιχνεύεται στις περιοχές με κόκκινη απόχρωση και οφείλει την παρουσία του στην στην χρήση της κόκκινης χρωστικής κινάβαρη (HgS). Πιο συγκεκριμένα, χρησιμοποιείται για την απεικόνιση του αίματος χωρίς πρόσμειξη με άλλες χρωστικές, αλλά και σε μείξη με άλλες χρωστικές, τόσο στο ιμάτιο του Χριστού όσο και στην αποτύπωση στο χρώμα του δέρματος. Παράδειγμα της χρήσης της χρωστικής στις προαναφερθείσες περιοχές παρουσιάζεται στην εικόνα 4.
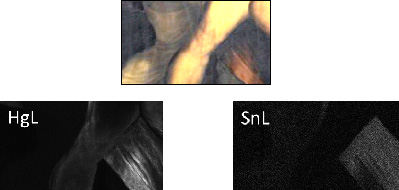
Tin (Sn) is detected in areas with a red tint, such as the garment of Christ, in the red details of the soldier’s clothing standing to his left, as well as in darker versions of the skin colour. An example of the use of the tin pigment is shown in Figure 5.
The detection of chromium (Cr) is found in the background, in the garment of the soldier to the left of Christ, but also in details such as the spears. Due to the strong presence of lead in almost the entire painting surface and the relatively small statistic of chromium, it is not possible to spatially correlate the presence of the two elements to validly support the identification of chrome yellow (PbCrO4).
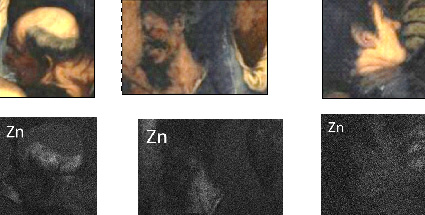
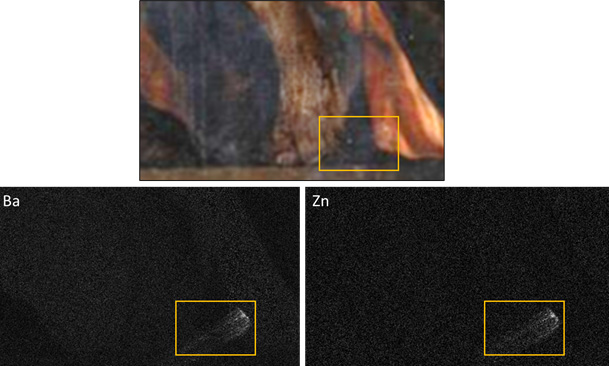
Zinc (Zn) has been used at selected sites, possibly through the use of zinc white (ZnO), possibly in mixture with other pigments to create photochromes. Examples of the use of zinc white pigment are shown in Figure 6. In only one case (Figure 7), the detection of zinc is associated with the simultaneous detection of barium (Ba) in a form resembling an arbitrary brushstroke, which is probably related to the use of the lithopone (BaSO4 + ZnS) dye.
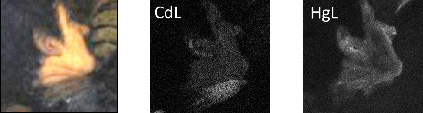
Cadmium (Cd) cannot be identified in particular if it has been used as a yellow (cadmium yellow – CdS) or red (cadmium red – Cd(S,Se) pigment. The detection of selenium (Se) is particularly demanding due to the strong overlapping of various characteristic X-rays of lead, an element that is strongly present over the entire surface of the painting. The cadmium pigment is mainly used in mixture with other pigments to obtain different shades. The hypothesis that cadmium is contained in yellow pigment could be supported by the fact that its mixture with cinnabar can be used to render the colour of leather, as shown in Figure 8.
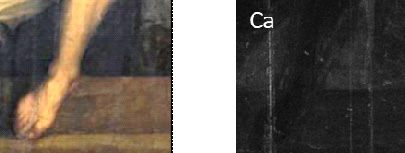
The presence of Ca is mainly observed in the dark/black areas. It is possible that calcium is a constituent of the canvas or has been used to prepare the substrate as there are formations in the calcium distribution that resemble abrasions on the painted surface (Figure 9). This could further explain its weak presence in the dark areas due to the use of an overlying organic black pigment that is not very absorbent to Ca’s characteristic X-rays. Also, the use of bone-black pigment cannot be excluded in the dark areas.