

The studies with FTIR Infrared Spectroscopy were carried out in the laboratory of physicochemical research of the National Gallery.
Infrared spectroscopy can provide characterization of classes of organic molecules (such as oils, resins, proteins, etc.) and inorganic compounds (minerals, pigments, etc.) and their mixtures. The mid-infrared region of the electromagnetic spectrum extends in the range 4000-400 cm-1. The radiation energy in this region is high enough to stimulate molecular vibrational transitions within a sample. Materials absorb different amounts of infrared radiation at different wavelengths depending on the chemical bonds present. With FTIR, chemical bonds and functional groups can be identified. FT-IR has been used extensively for both organic and inorganic painting materials on both wood and textile substrates.
FT-IR allows the identification of proteins and oils (Derrick, 1994). However, in the case of organic mixtures, interpretation of the spectra and characterization of the media present can be problematic (Colombini and Modugno, 2004). The identification is based on the detection of amide bond bands characteristic of proteins and the detection of triglycerides present in oils (Pilc and White, 1995; Kouloumpi et al, 2006; Meilunas et al, 1990). In 2005, Van der Weerd et al. published a study on the effect of dyes on the aging process of oily binders, showing the importance and use of FTIR as an analytical technique leading to the characterization of binders. For the case of pigments, FT-IR was a valuable tool. A number of studies have been carried out through different research groups (Bikiaris et al., 1999; Khandekar et al., 2010; Mateo et al., 2009). Similarly, FT-IR has successfully characterized substrate materials (Scott et al., 2009; Genestar, 2002) as well as the varnish layer (Prati et al., 2010; Vagnini, 2009).
In the case of Muller’s “March 30, 1814” painting, infrared spectroscopy was performed with a Perkin Elmer Spectrum 100 FTIR system. The purpose of the infrared spectroscopy study was to provide information on the type of varnish, selected pigments, binders, and the materials used as substrates. For the analytical procedure, powder scrapings of a few micrograms were required from the layers under analysis.
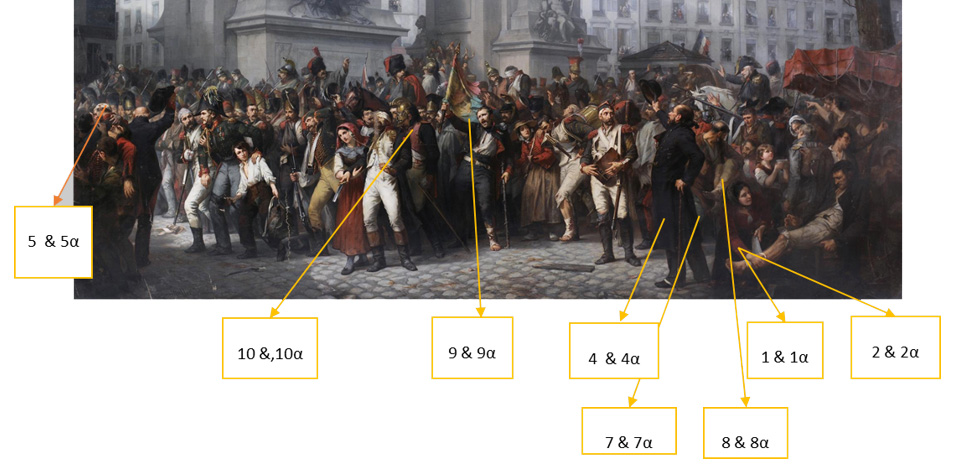
A total of eleven (11) micro-samples in the form of shavings were removed from the project (Figure 29). Ten were for the paint layer and one, the varnish layer.
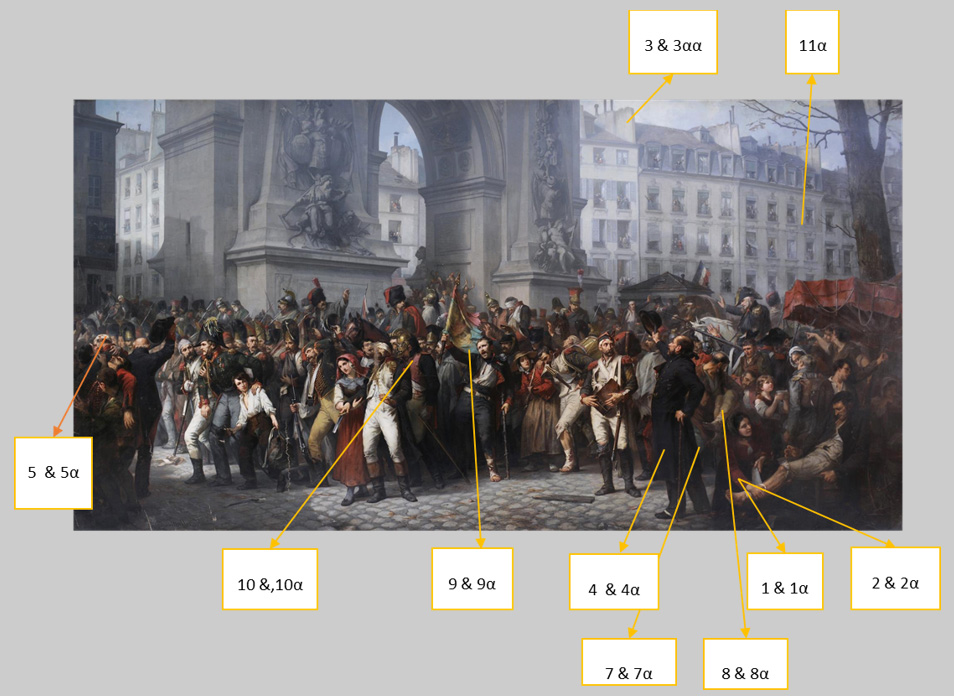
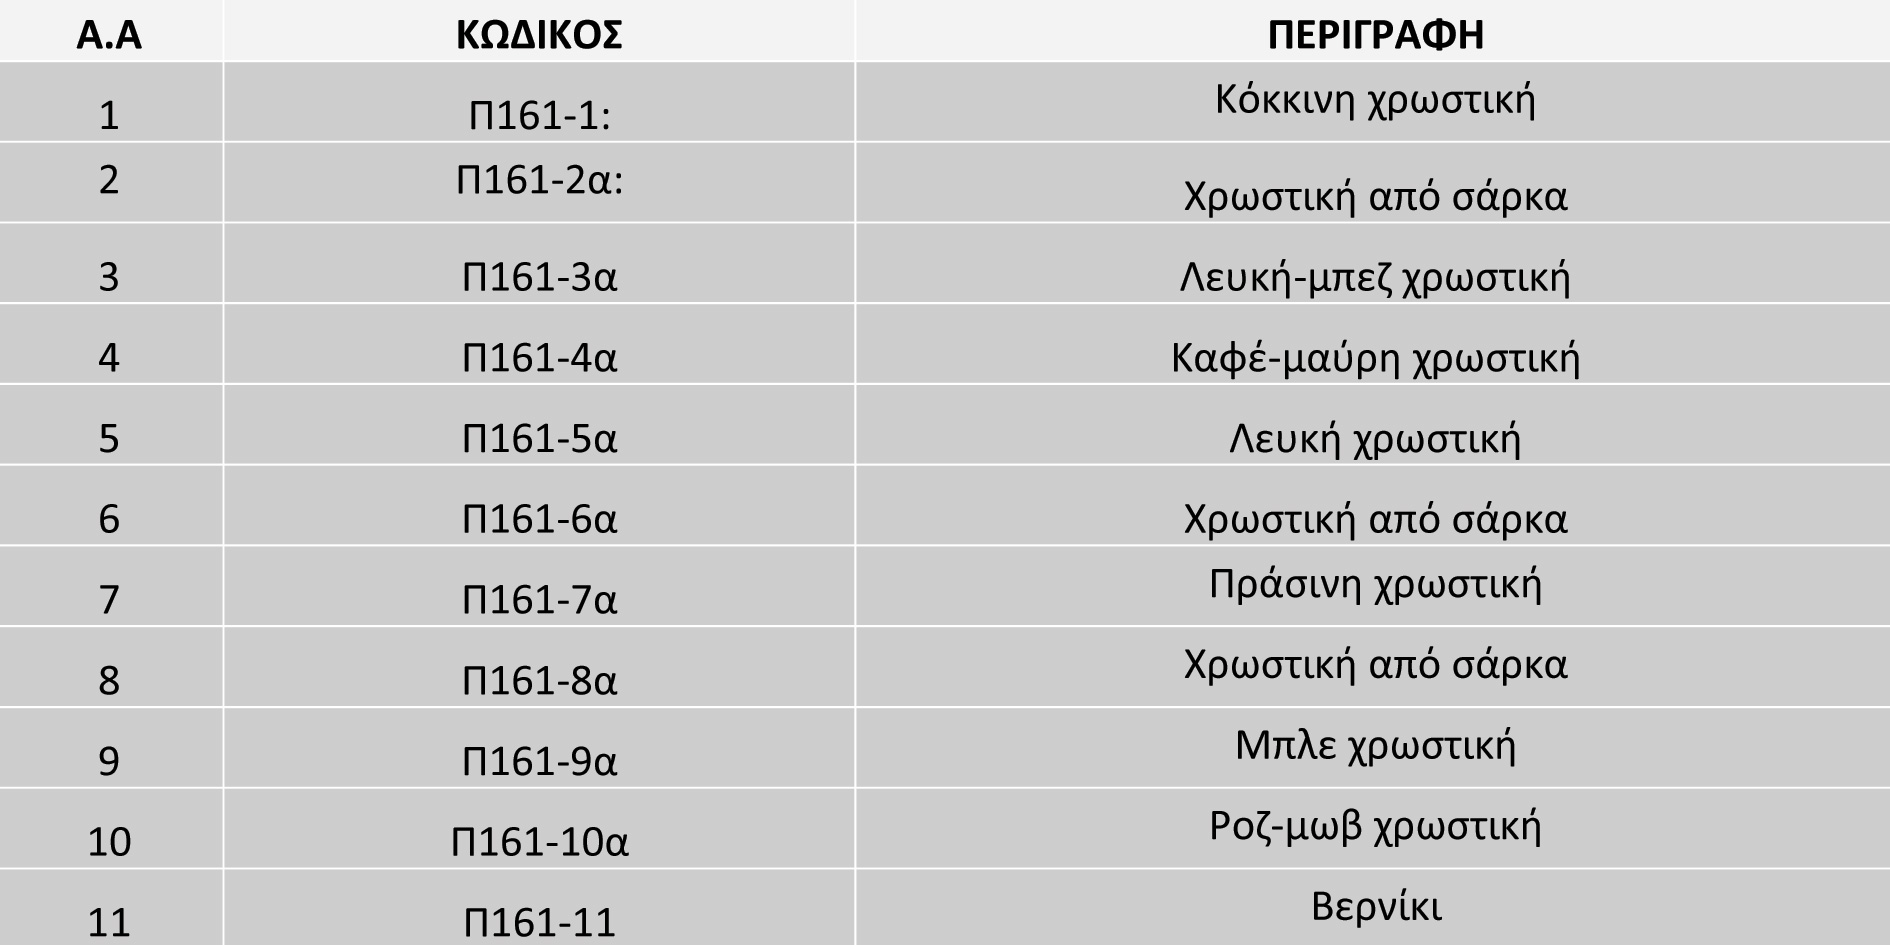
Specifically, the samples taken had as main objective to identify, by conventional physicochemical techniques, the construction materials of the project. All samples, except one from the varnish layer, were taken from the upper paint layer and are summarised in the table below (Table 1).
Results
P161-1, Red dye
Most absorption regions of the infrared spectrum (P161-1 (red dye), corresponding to red ochre, lead white and natural resin. Absorption areas of organic medium corresponding to animal glue (rabbit’s foot) are detected.
P161-2, dye from flesh
Most of the absorption areas of the infrared spectrum (P161-2 (flesh pigment)) correspond to red ochre, lead white, natural resin, animal glue (rabbit pellets) and titanium white, probably derived from post-treatment material (e.g. preservation).
P161-3, White-beige pigment
Sample P161-3 shows the same absorption areas as sample P161-2. Most of the absorption areas of the infrared spectrum (P161-3 white-beige dye)), correspond to red ochre, lead white, natural resin. Peaks corresponding to fatty organic binder, probably linseed oil and animal glue (rabbit glue) are also recorded in this sample.
P161-4, Brown-black pigment
Sample P161-4 (P161-3 (brown-black dye)) shows absorption areas corresponding to carbon-containing dye (e.g. carbon black or ivory) and roasted ombre. Peaks corresponding to an organic binder, probably linseed oil and animal glue (rabbit’s foot) are also recorded in this sample.
P161-5, White pigment
Most absorption regions of the infrared spectrum (P161-5 (white dye)) correspond to the white of lead and animal glue (rabbit’s foot).
P161-6, flesh dye
Sample P161-6 shows the same absorption areas as samples P161-2 and P161-3. Most of the absorption areas of the infrared spectrum (P161-6 flesh pigment)) correspond to red ochre, lead white, rabbit’s foot, natural resin. Peaks corresponding to fatty organic binder, probably linseed oil, are also recorded in this sample.
P161-7, Green pigment
Sample P161-7 shows absorption regions of the infrared spectrum (Figure 36) (P161-7 green dye) corresponding to cadmium green or cobalt green, Prussian blue, rabbit’s foot, lead white and synthetic resin.
P161-8, Flesh dye
Sample P161-8 shows the same absorption areas as samples P161-2, P161-3 and P161-6. Most of the absorption areas of the infrared spectrum (P161-8 flesh pigment)), correspond to red ochre, lead white, natural resin, rabbit’s foot. Peaks corresponding to fatty organic binder, probably linseed oil, are also recorded in this sample.
P161-9, Blue pigment
Sample P161-9 shows absorption regions of the infrared spectrum (P161-9 blue dye) corresponding to ultramarine blue, rabbit’s foot, lead white and synthetic resin.
P161-10, Pink-purple dye
The infrared spectrum of sample P161-10 (P161-10 (pink-purple dye), appears to contain the purple caput mortum dye (Figure 42), animal glue (rabbit collar), natural resin (gomalaka), and lead white.
P161- 11, Varnish
According to the infrared spectrum of sample P161-11 (P161-11 (varnish)) (Figure 43) the sample appears to contain natural resin (gomalaka) (Figure 44), synthetic resin as well as lead white.