Macroscopic X-ray fluorescence spectrometry (MA-XRF) imaging technique enables non-destructive elemental mapping of large surface areas. It has a wide application in the analytical examination of works of art, through the identification of the distribution of inorganic chemical elements on the painted surface. In July 2023, under the auspices of the National Gallery of Athens, MA-XRF measurements were carried out on the painting “March 30, 1814” by Muller Charles-Louis-Lucien. The painting’s year of creation is 1855 and its dimensions are 445cm x 845cm.
The analysis was focused on areas of particular scientific interest, due to the diversity they present in the pigments and techniques used. The pigments identified are consistent with those available to artists in the second half of the 19th century.
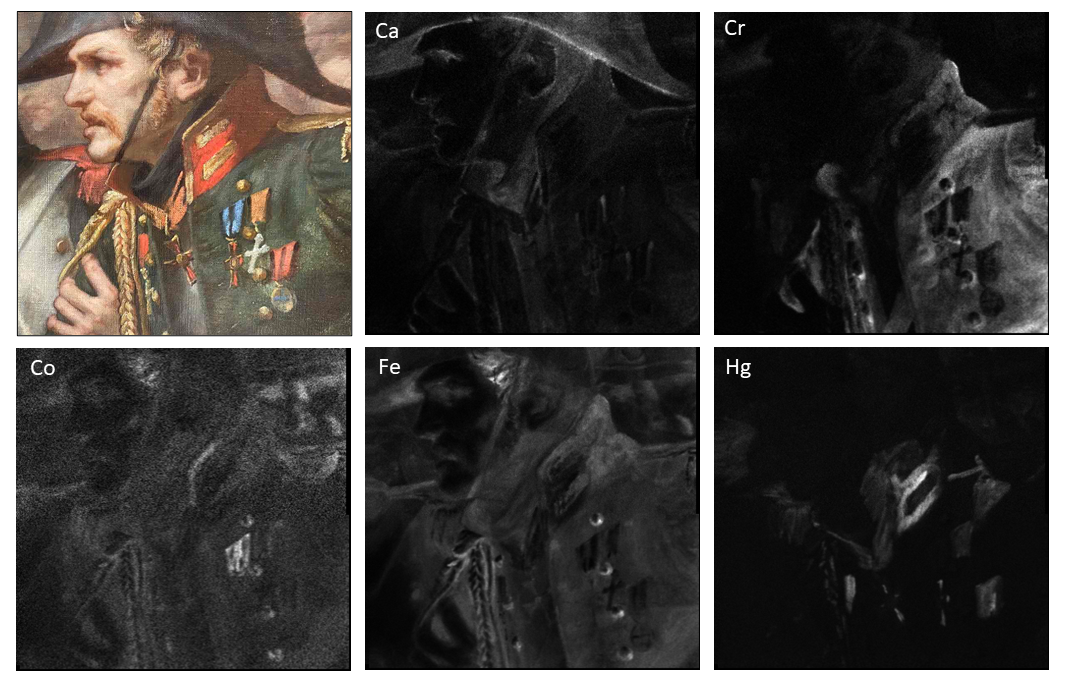
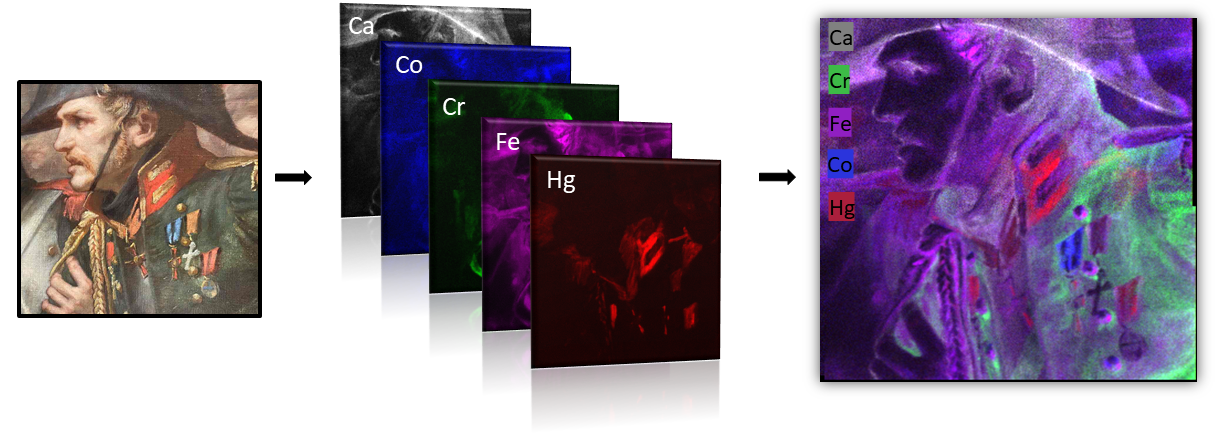
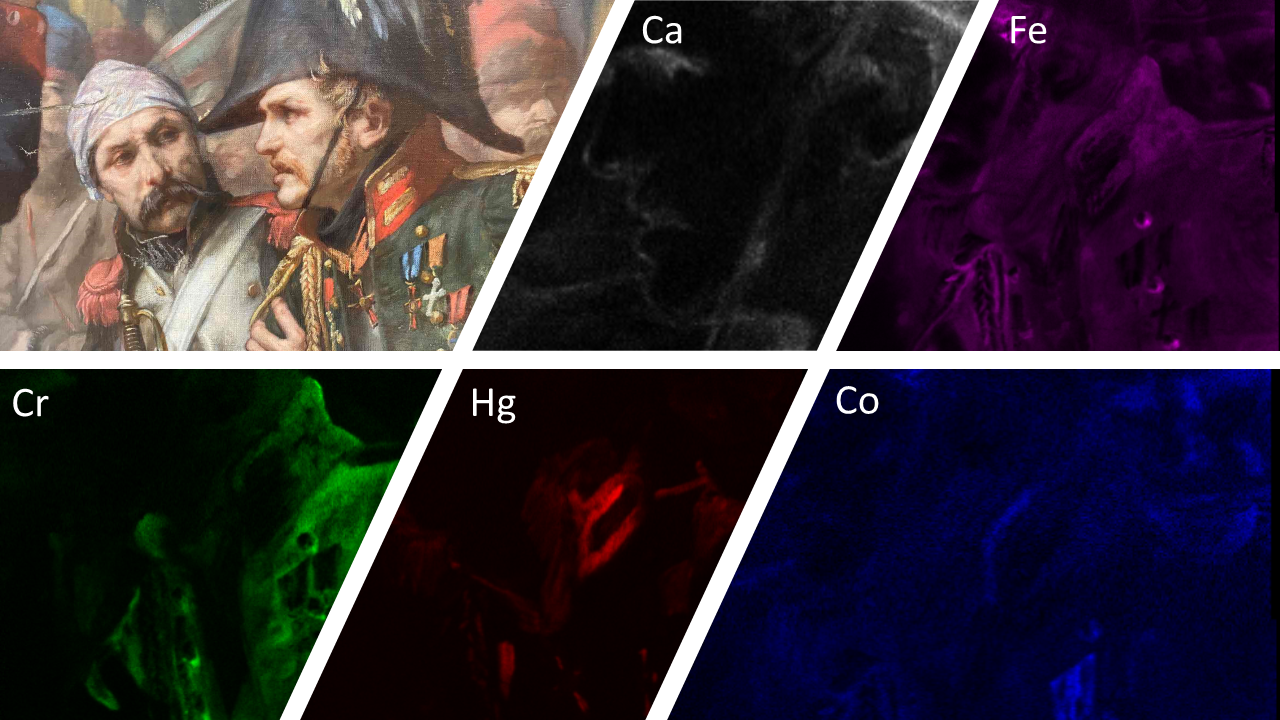
The main elements detected overall on the painted surface are lead (Pb), iron (Fe), calcium (Ca), chromium (Cr), cobalt (Co), mercury (Hg) and manganese (Mn). Also, barium (Ba), copper (Cu), potassium (K), sulfur (S), titanium (Ti) and zinc (Zn) are detected as trace elements.
Lead (Pb) is detected on the studied painted surface, probably in the form of lead white (2PbCO3·Pb(OH)2) mixed with other pigments to achieve lighter shades. Calcium (Ca) is detected in the dark/black areas and is contained in a pigment used mainly to create outlines in representations. Chromium (Cr) is detected in green areas and is associated with pigments containing chromium oxide, in hydrated (viridian – Cr2O3 • 2 H2O) or anhydrous form. Cobalt (Co) detection is carried out in areas with a blue hue. Iron (Fe) is detected in red, yellow and dark/black areas, which indicates that different iron-based pigments have been used by the artist, such as red/yellow ocher and manganese black. Also, mercury (Hg) has been detected in red areas, the presence of which leads us to the conclusion that the pigment cinnabar has been applied.